Reuse dashboards with Amazon QuickSight templates
A guide on how to reuse business intelligence dashboards for multiple customers using Amazon QuickSight templates.
 Amazon QuickSight
 AWS Tools and SDKs
 Boto3 (AWS SDK for Python)
 Python


The rise in popularity of applied data science caused a huge wave of startups trying to solve various business problems. All a company has to do is to hook their databases into a business intelligence platform to harvest insights generated from data.
These SaaS platforms typically serve business insights to their customers via interactive visualizations. Customers (tenants) log into the application and then browse various dashboards to understand their business better.
While there are JavaScript libraries allowing you to build dashboards by hand, most BI companies tend to use specialized Business Intelligence solutions like Tableau, Qlik, Microsoft PowerBI, Looker or Amazon QuickSight to build these dashboards. These services not only allow you to build your visualizations with a GUI but often come with solutions for identity and access management, security, data storage, serving and caching.
Amazon QuickSight is one such service - a cloud-native, serverless Business Intelligence solution from AWS. You can connect various data sources, build your interactive dashboards filled with widgets and then embed those dashboards into your web application. It also features a computation engine called SPICE that moves any heavy calculations from hitting your data sources directly into a robust in-memory engine inside QuickSight.
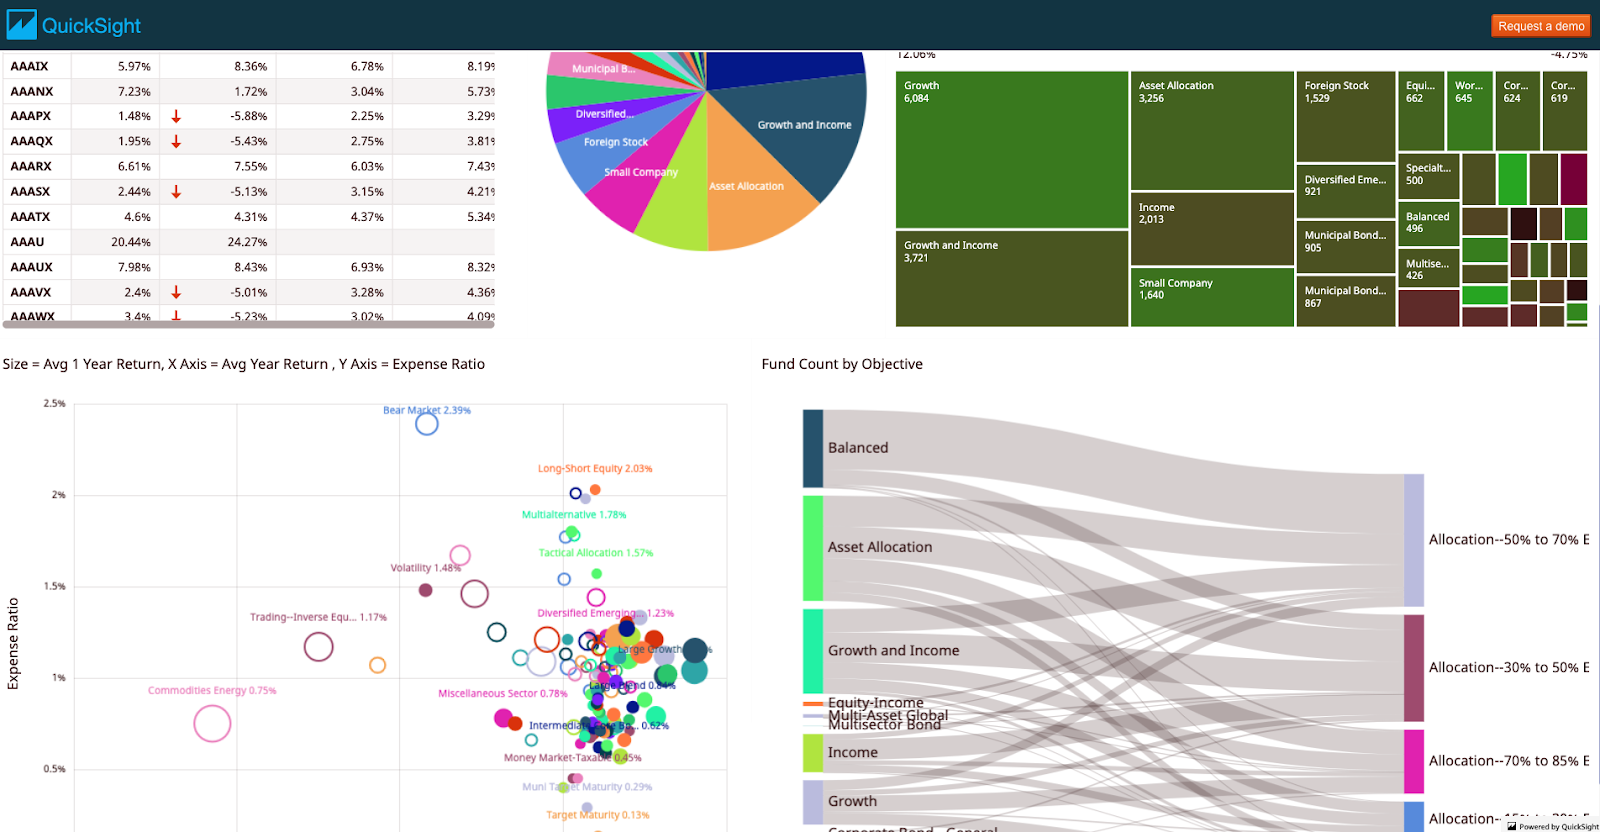
Example dashboard built in Amazon QuickSight. For more examples across different industries go to Amazon QuickSight gallery.
Software as a Service considerations
One of the main objectives for a SaaS owner is to ensure that all their customers run the same version of the product. While they sometimes allow tenant-specific customizations, plugins or multiple tiers, the core of the product stays and looks the same for all tenants. When a new version of the product is deployed, it should be gradually applied for all tenants with minimal human interaction. The “little human involvement” requirement is crucial when you have dozens or hundreds of tenants.
Maintaining the same version of the product and minimizing the overheads associated with it is especially challenging in the case of Business Intelligence solutions. This is because you often don’t have direct access to the backend or the database of the tool itself and need to work your way around their APIs. Obviously, you can’t just copy the new widget from dashboard to dashboard for every tenant manually — it breaks every good programming practice, and it will never scale business-wise.
If you are using Amazon QuickSight — you’re in luck. It has a capability called Templates, which allows you to tackle this exact issue with little effort.
Amazon QuickSight basics
To better understand the QuickSight Templates, we must describe the basic building blocks.
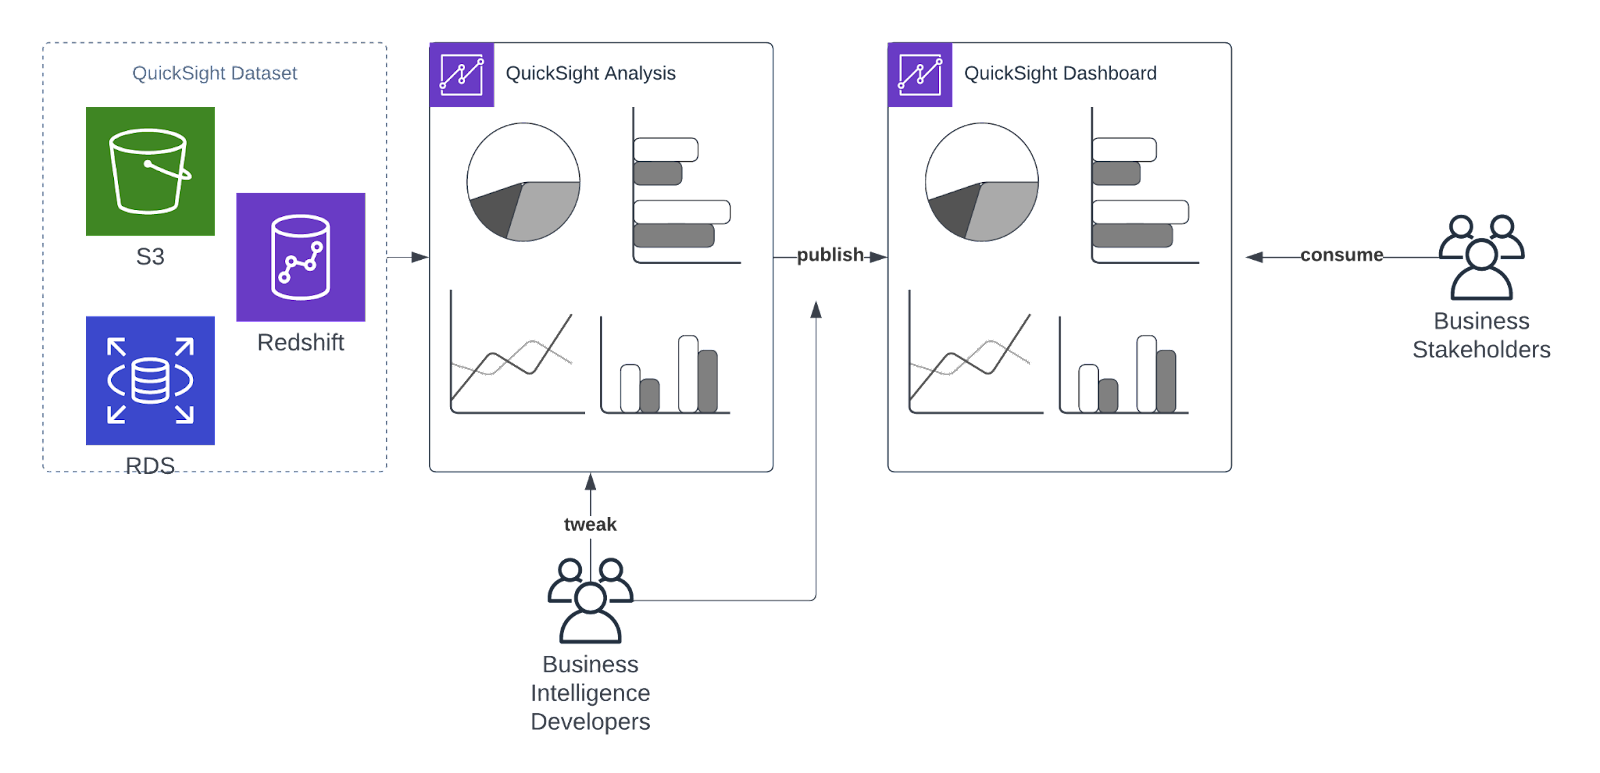
First, you link your Datasets, define their schemas and allow QuickSight to query them. When the data is accessible, you build your Analysis by adding visuals from the many available widgets. Finally, when the analysis is ready, you publish it as a Dashboard and then let your users access it by embedding it on your website or logging to QuickSight directly.
The “naive” BI SaaS solution
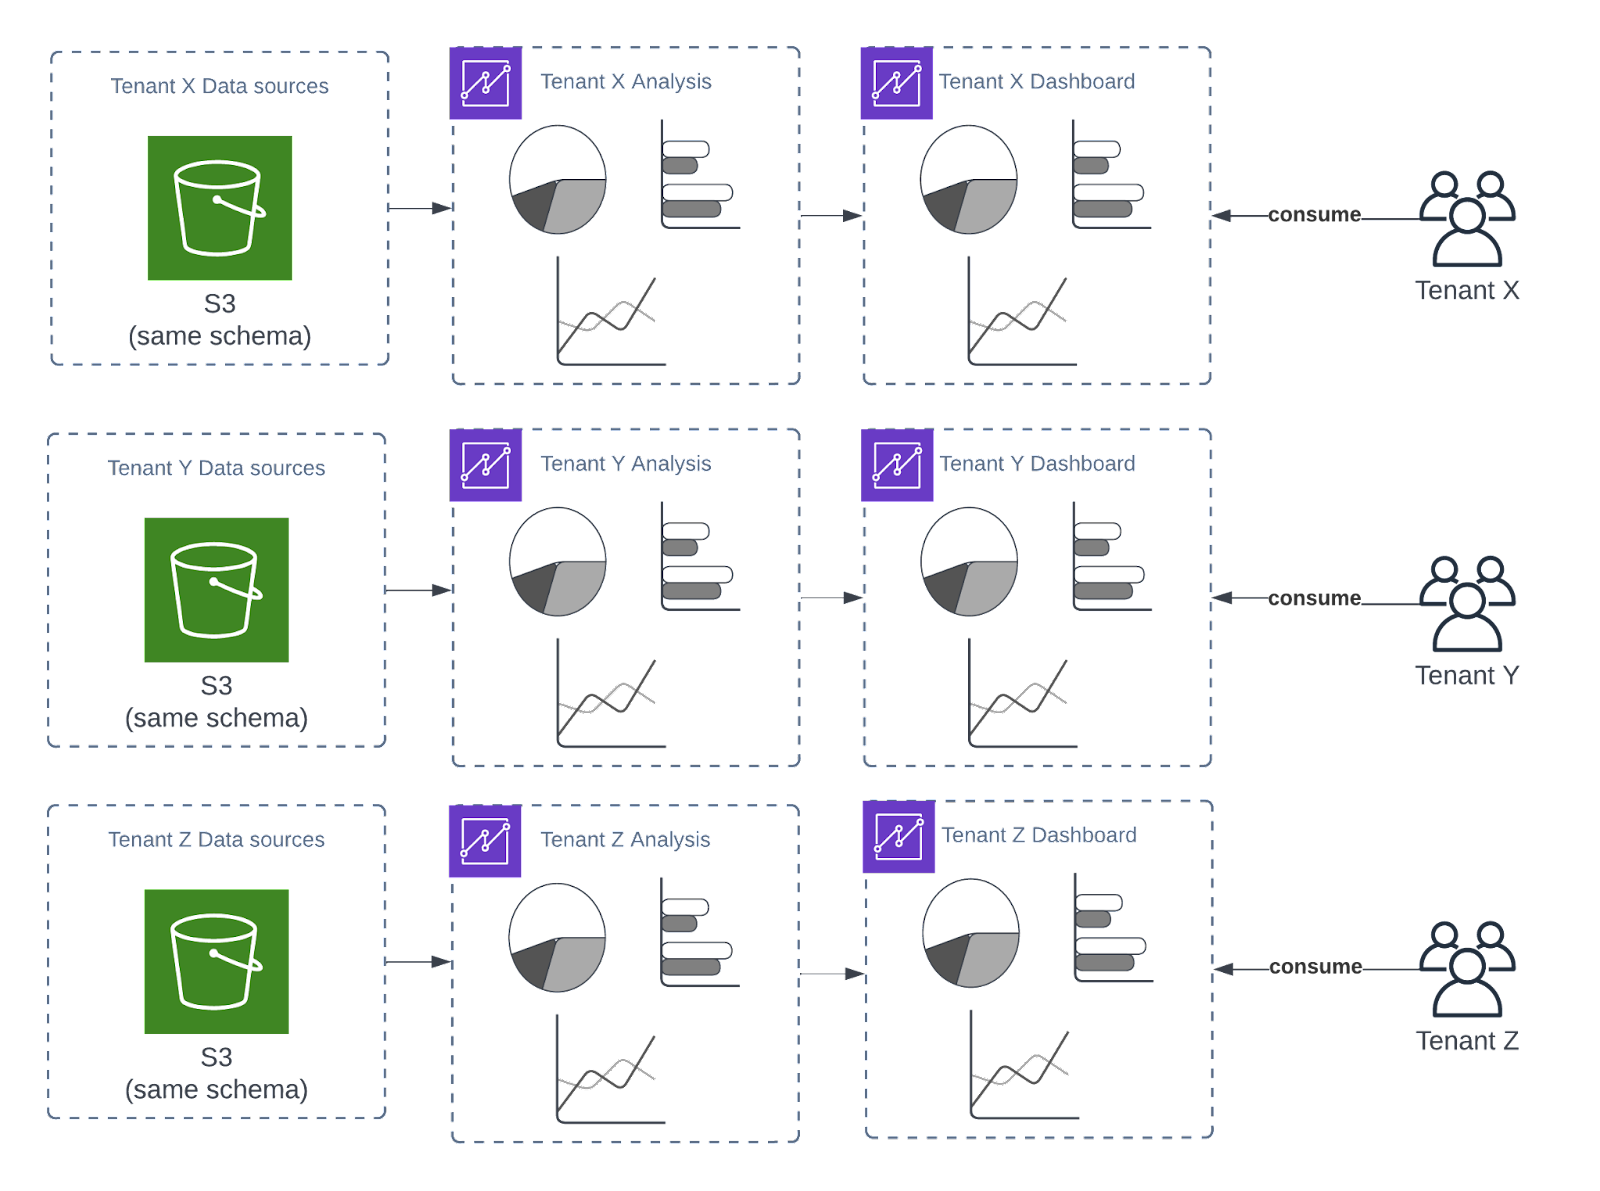
In most multi-tenant SaaS applications, tenants have their own dashboards with their own datasets. However, dashboards and widgets themselves look the same for each tenant. The same “monthly revenue chart” is drawn, but with a different underlying dataset.
Most importantly, the dataset for each tenant has the same schema. Initial schema standardization is done via various ETL/ELT processes before data is stored in its final warehouse destination and queried by the BI tool. This is mandatory if a product aims to handle hundreds of customers.
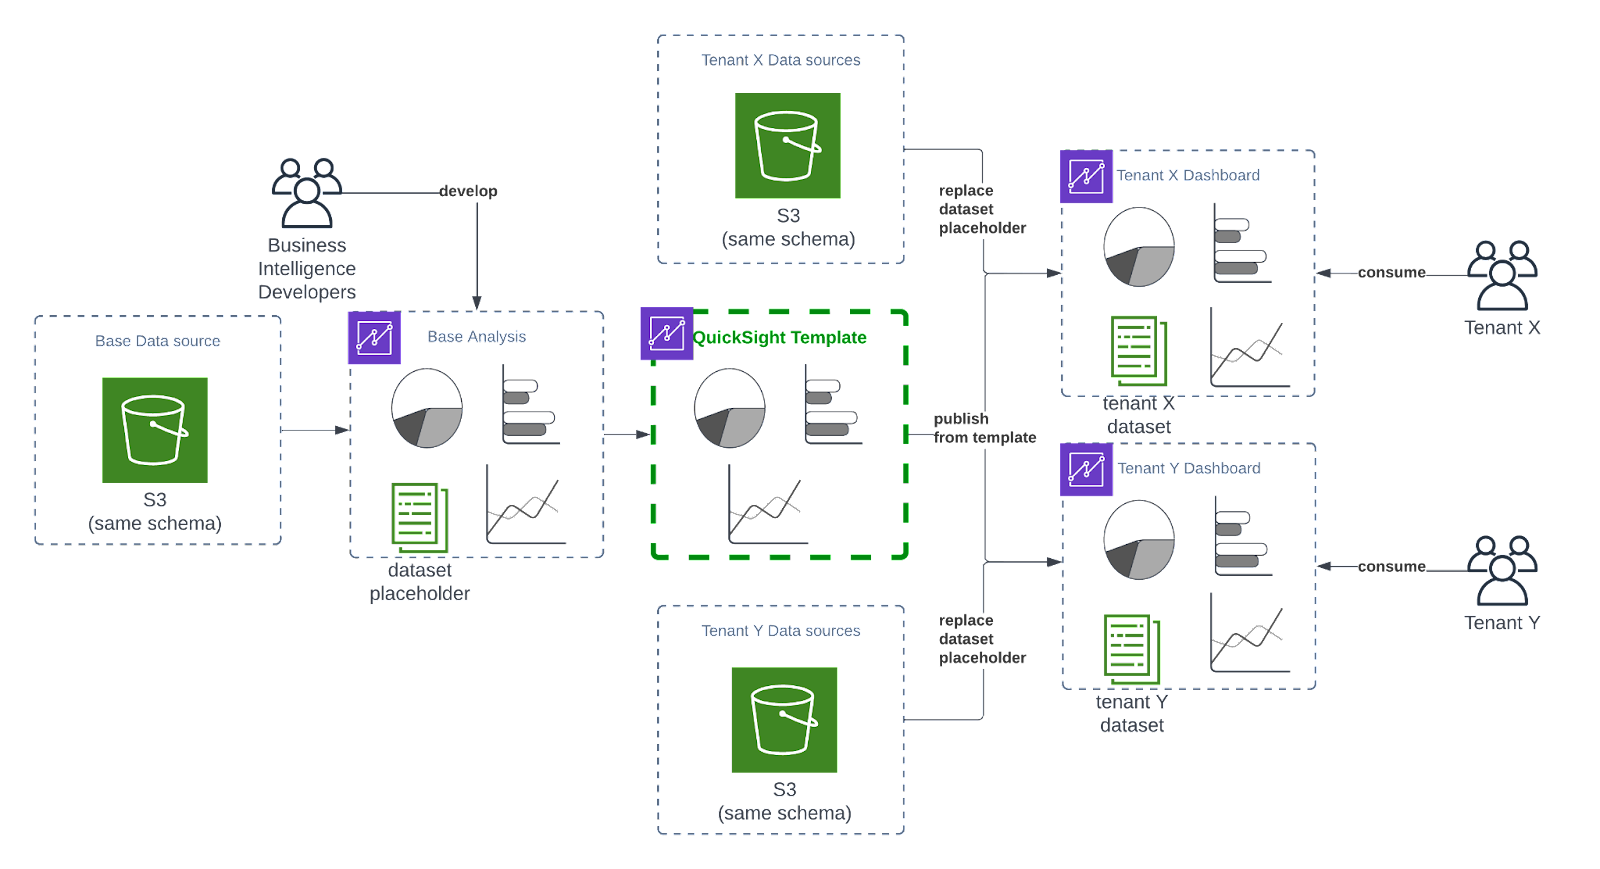
The “naive” solution for a SaaS BI product looks as follows:
However, this approach is problematic. Whenever you update your dashboard, for example by adding a new visualization, you can not apply the change on all dashboards.
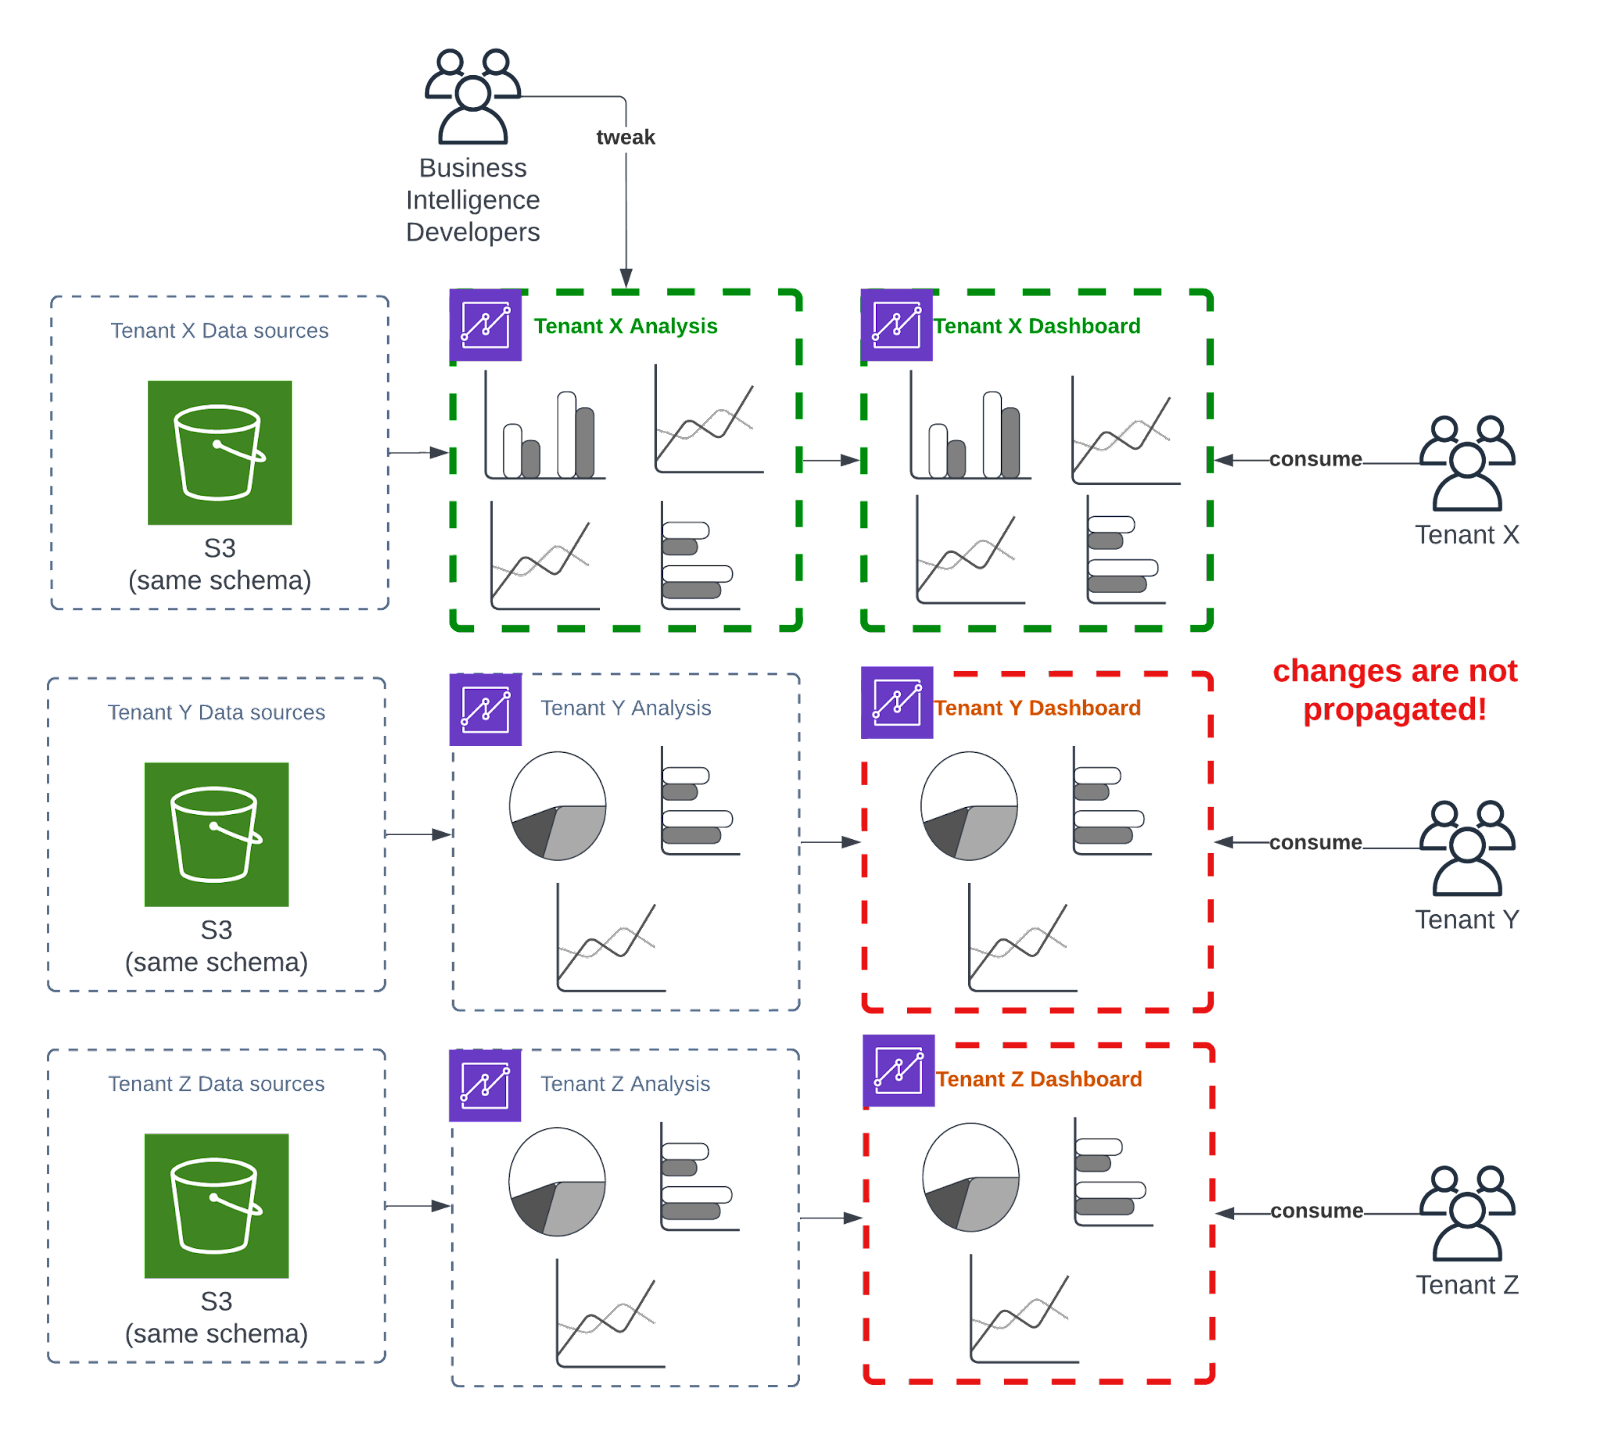
Every change has to be propagated manually. This may mean hundreds of thousands of man-hours!
QuickSight templates to the rescue
Thankfully, that was only a naive solution. In this place QuickSight Templates come in to save the day. Templates allow you to define a reusable template for the dashboard, not bound to any specific tenant. The template has also a dataset placeholder, meaning that you can instantiate a copy of that dashboard with a different dataset, as long as both have the same schema.
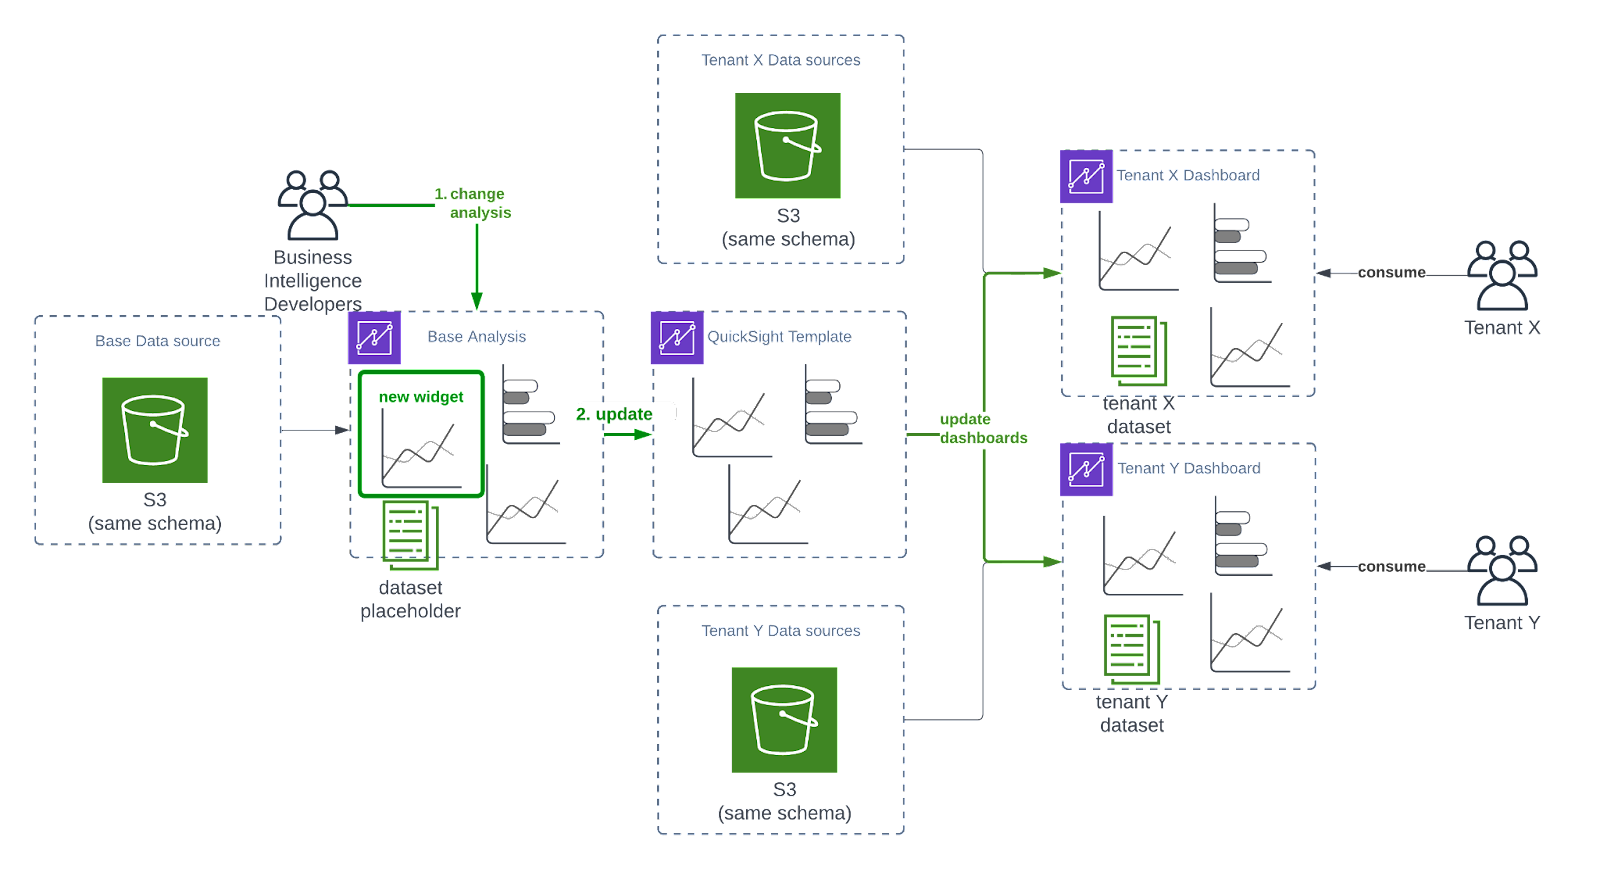
Generally speaking, this solves the problem of propagating new versions of datasets or rapidly adding a new tenant. Your business intelligence developers work on the base, abstract analysis. Whenever they want to deploy their changes, all they have to do is to update the template and then update each dashboard. Both are only one API call away.
Metaphorically speaking - this is a simple object oriented programming, where the Template is a class and tenants’ Dashboards are objects of that class. This also allows you to propagate the changes at your own pace and perform A/B tests.
QuickSight Templates walkthrough
We conclude this article with a basic demo of the functionality. We will create three fake tenants of our SaaS application and demonstrate how Amazon QuickSight Templates can be used to rapidly deploy new changes on our tenants’ dashboards.
Step 1 - Create and import datasets
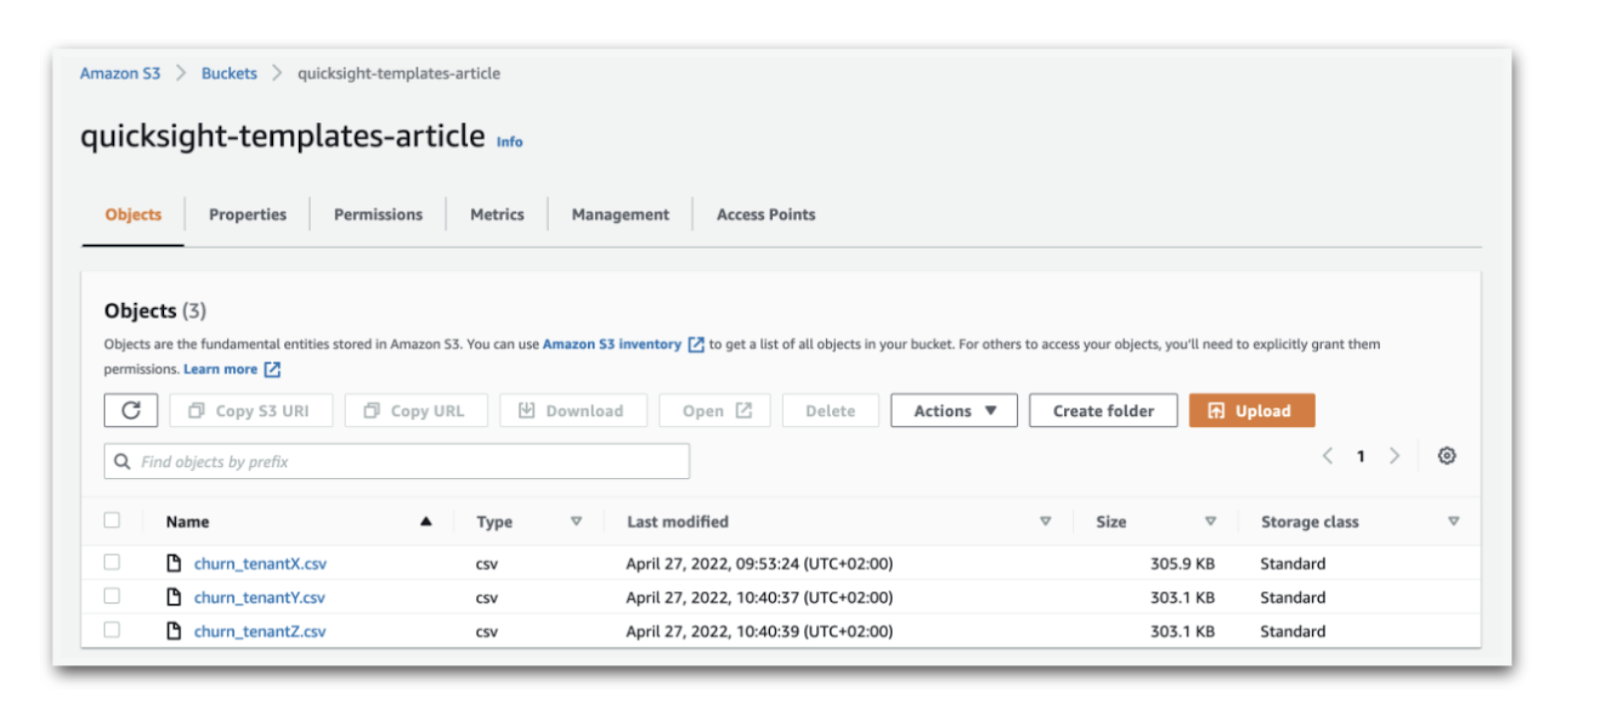
QuickSight can query various sources like Redshift, Snowflake, Aurora, RDS, Salesforce, but in this example we will use the most basic one — Amazon S3. We upload a public churn dataset of a telco operator to a S3 bucket and create 3 copies of it, each pretending to contain data from a different tenant. Note that they could differ in the data, but their schema is the same.
Then, we can move to the Amazon QuickSight service. If you opened it for the first time, you need to configure it first. For this tutorial, a Standard version with a free trial is sufficient.
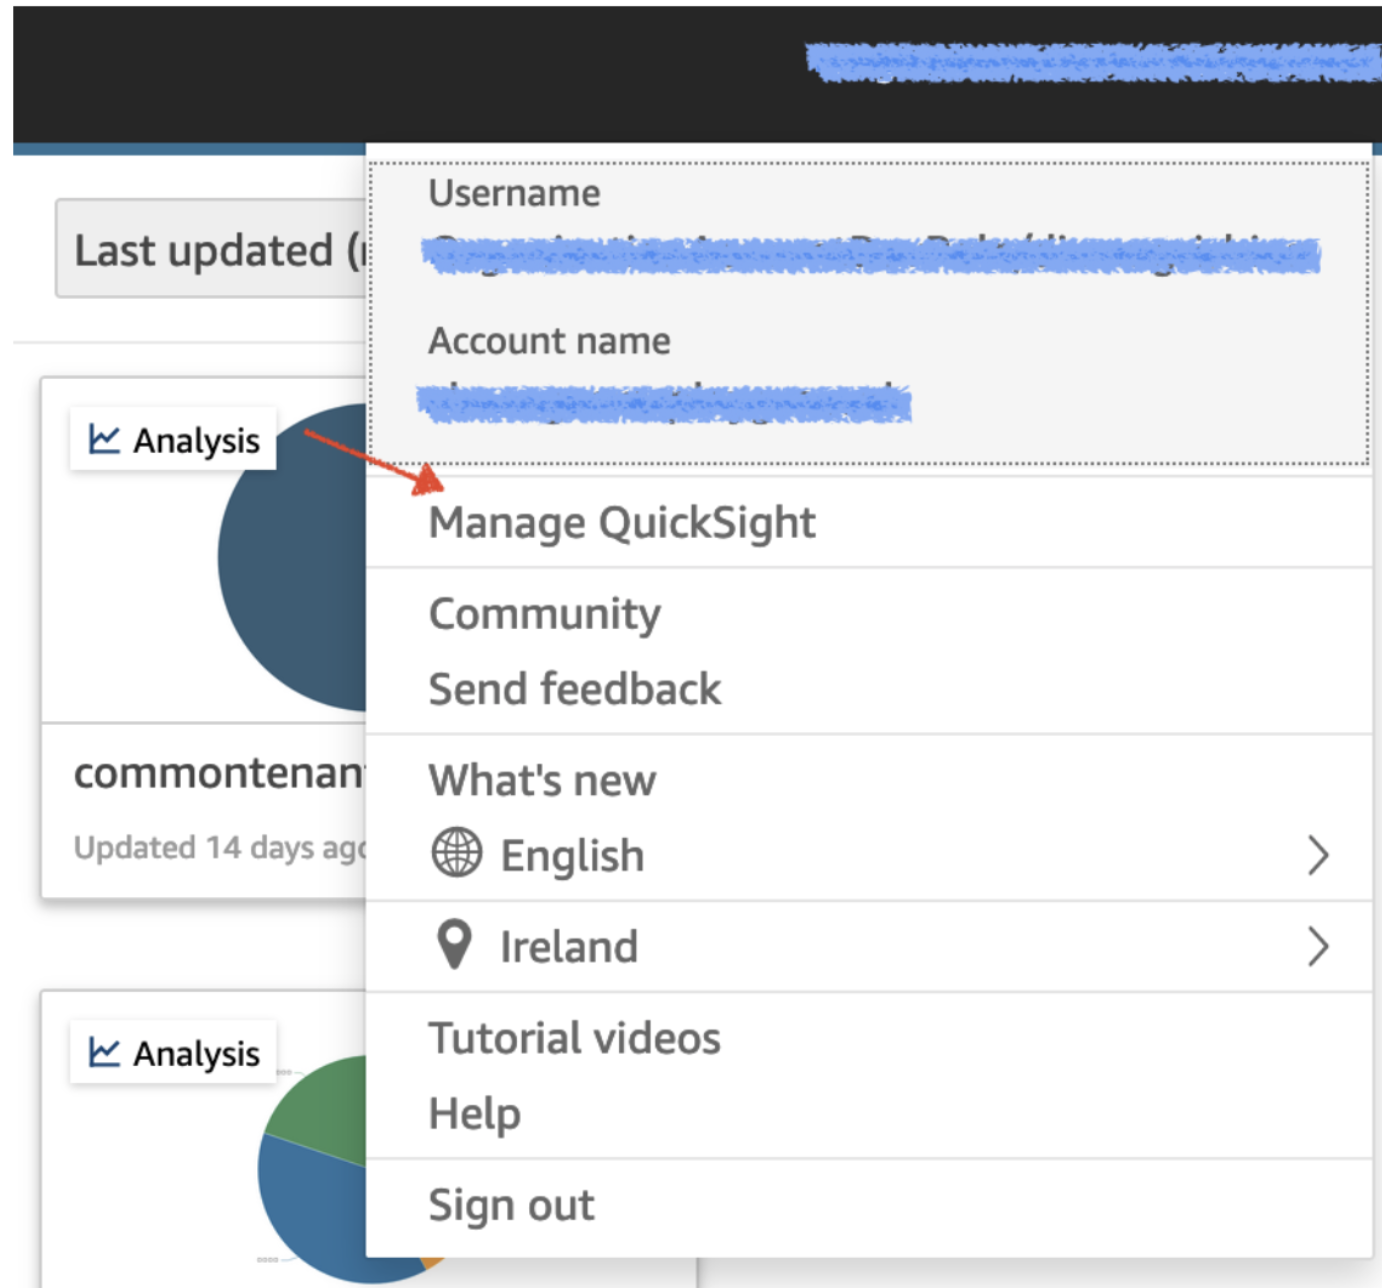
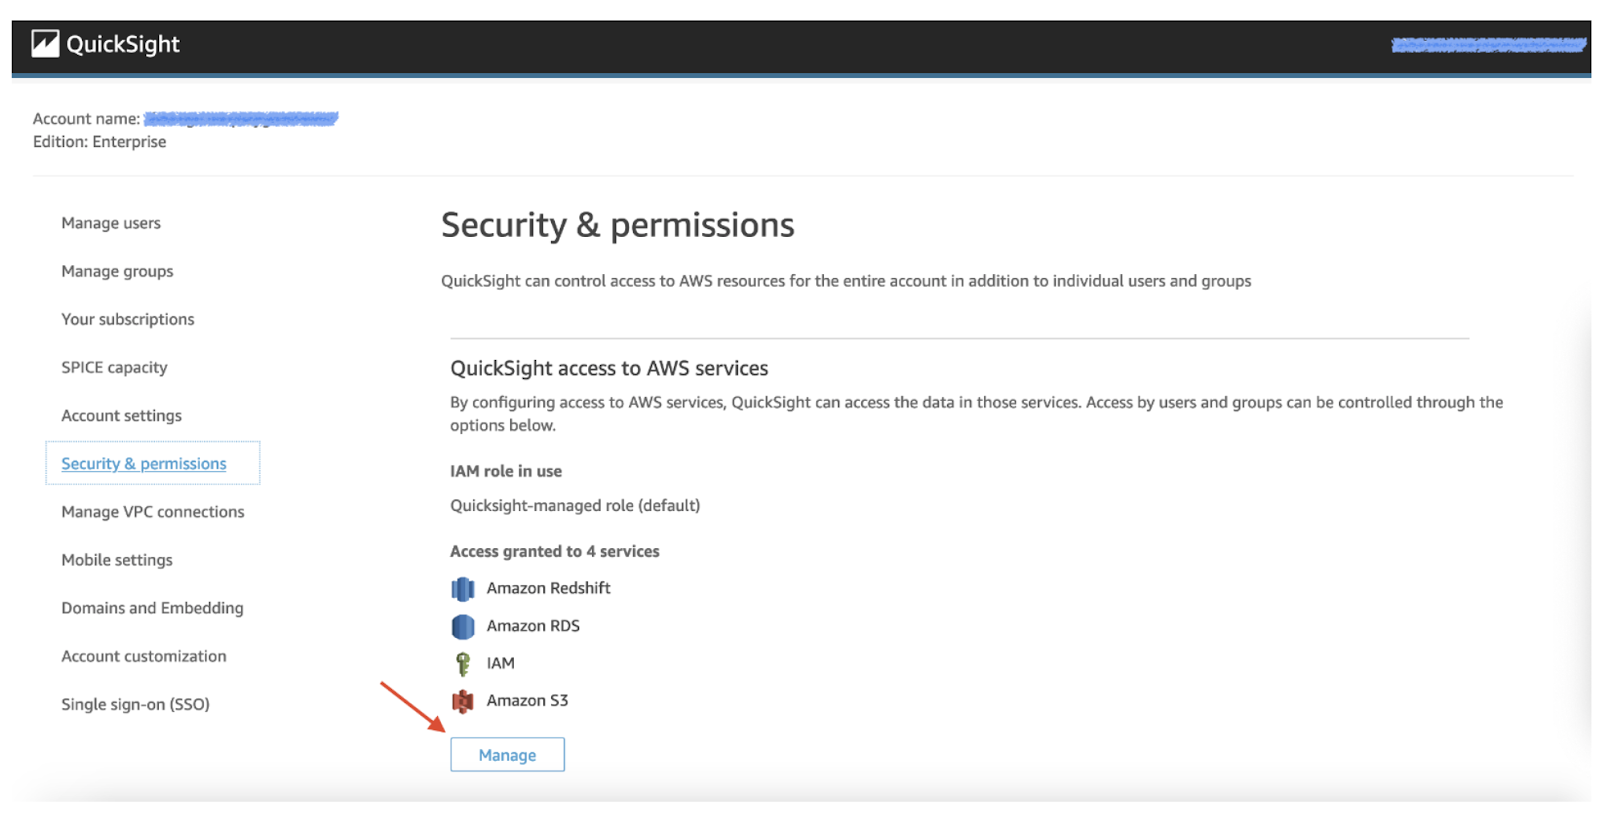
We also need to allow QuickSight to access that bucket. To do so, go to Manage QuickSight in the top right corner.
Then, go to the Security & Permissions tab and click on Manage. Select the bucket with your datasets.
After that, we can finally upload our data from S3 to QuickSight. We will repeat the next steps two more times, to import each tenant’s data.
First, create a manifest.json file for QuickSight and save it on your disk. This file specifies which files from S3 should be imported to QuickSight, what is the delimiter, format and so on. For our use case, its contents are pretty basic:
{"fileLocations": [{"URIs": ["s3://quicksight-templates-article/churn_tenantX.csv"]}]}
Note the churn_tenantX.csv in the URIs.
Then, go to the Datasets tab and choose New Dataset. There, select the S3 option.
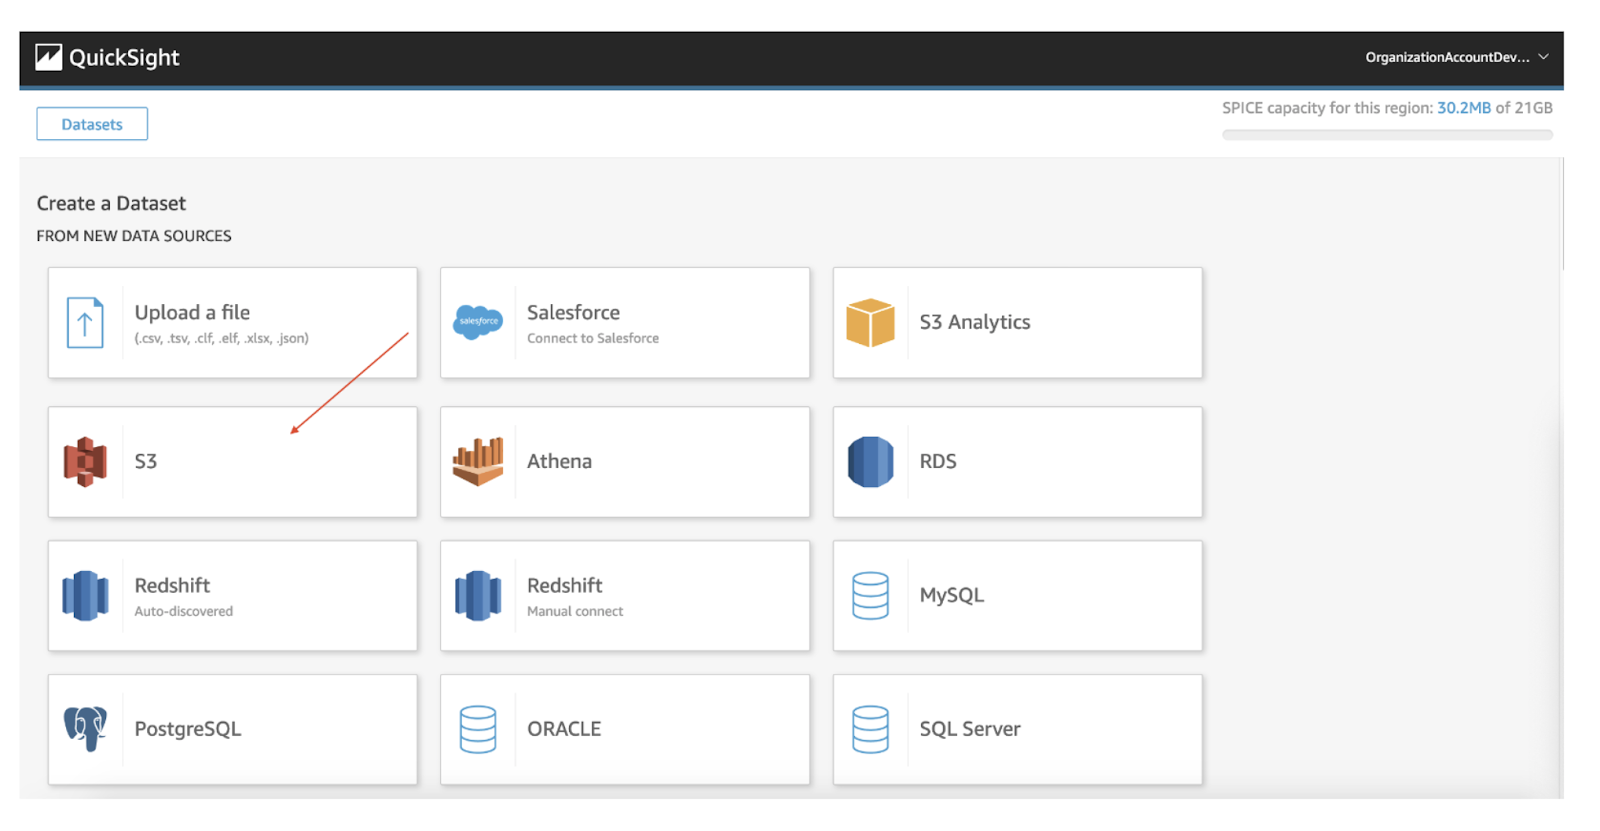
Name the data source however you want (using tenant’s name in it is a great idea):
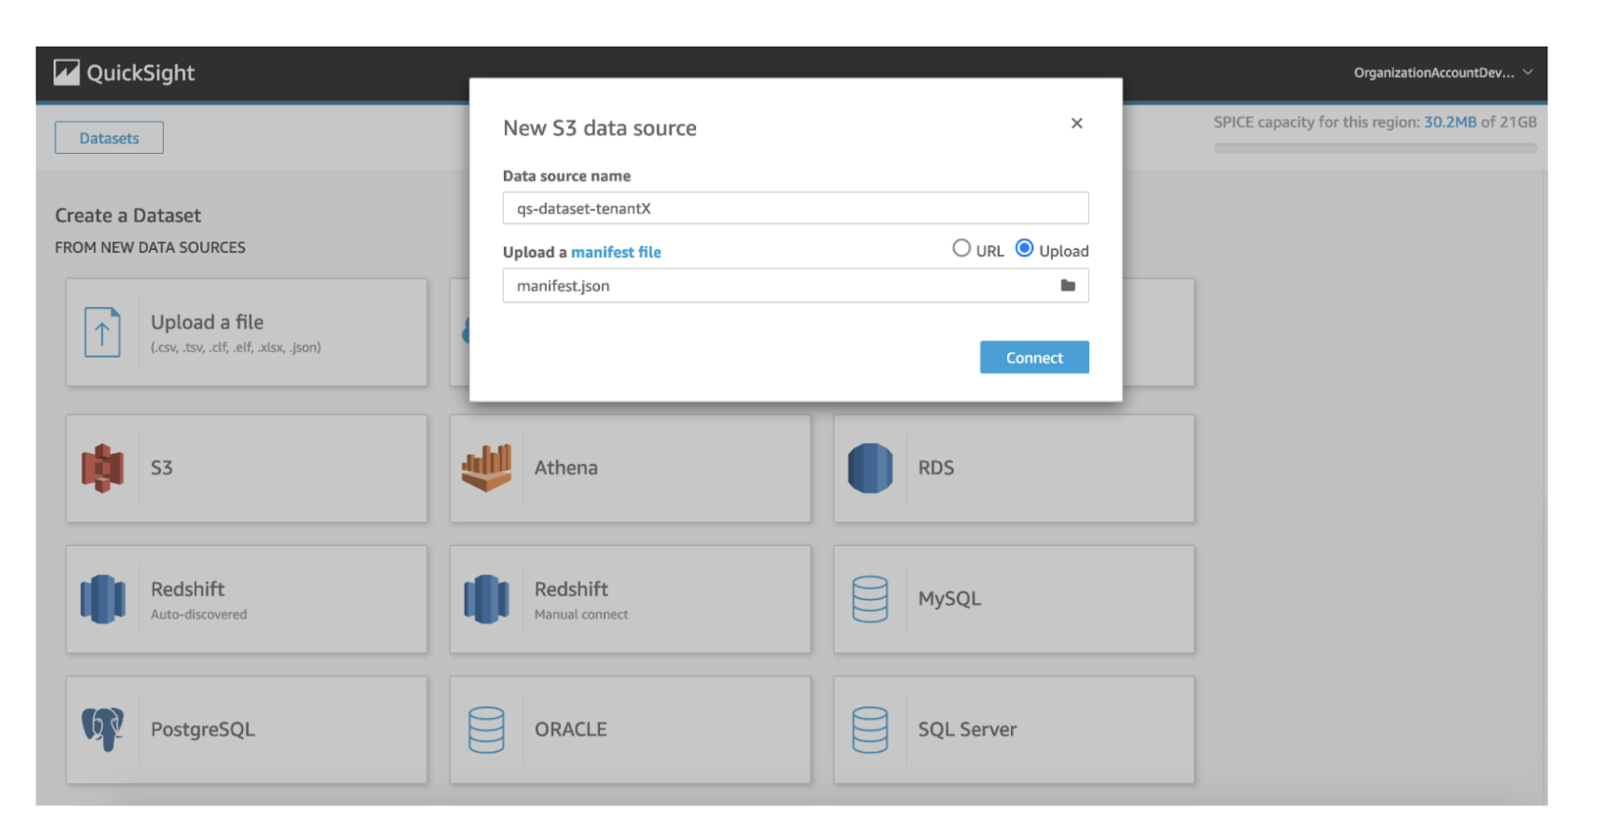
Click on Connect. If everything went smoothly, a “Finish dataset creation” should appear.
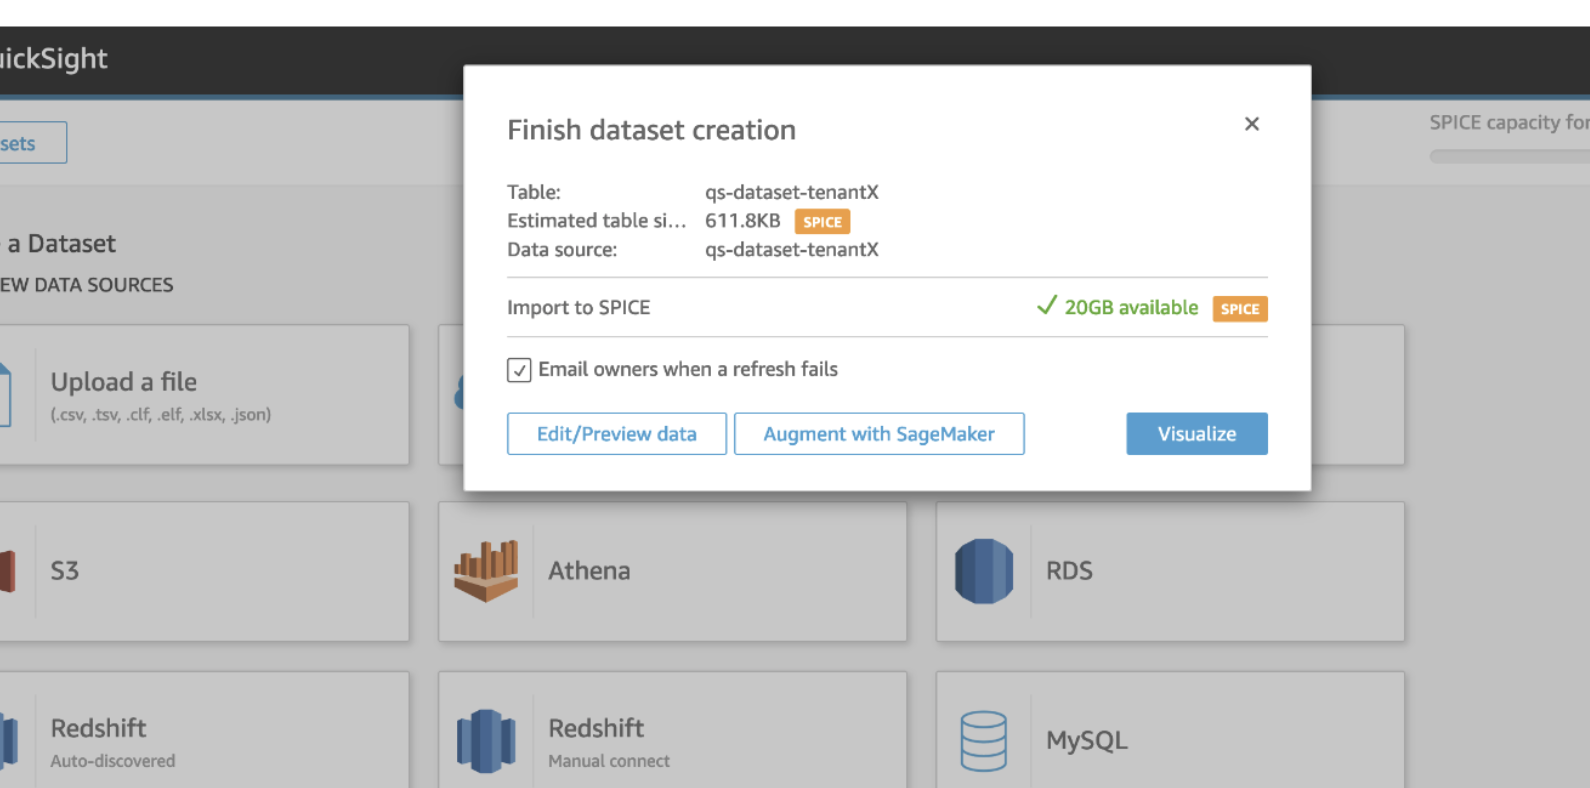
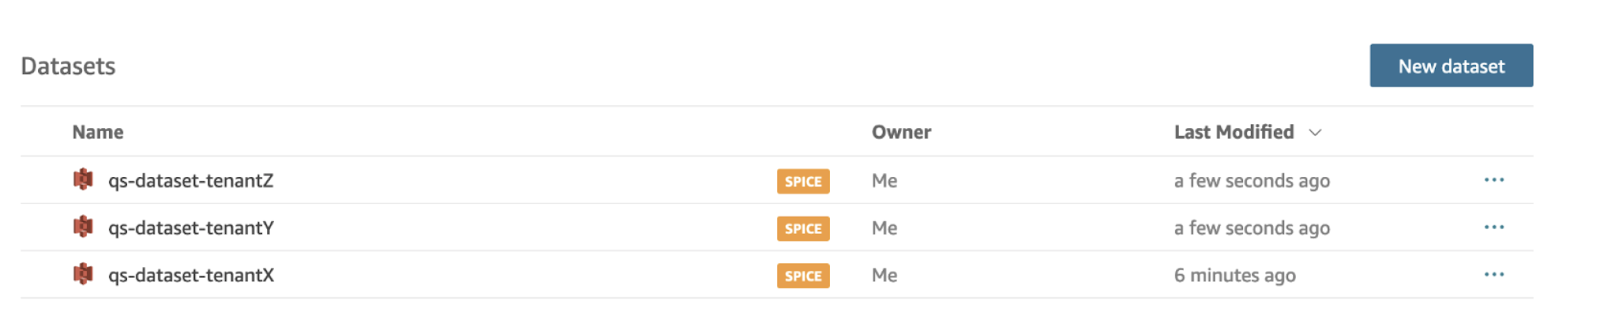
Repeat this step twice, for two more tenants. Replace tenantX with tenantY or tenantZ in resource names and manifest.json. The result should look as follows:
Step 2 - Create an Analysis
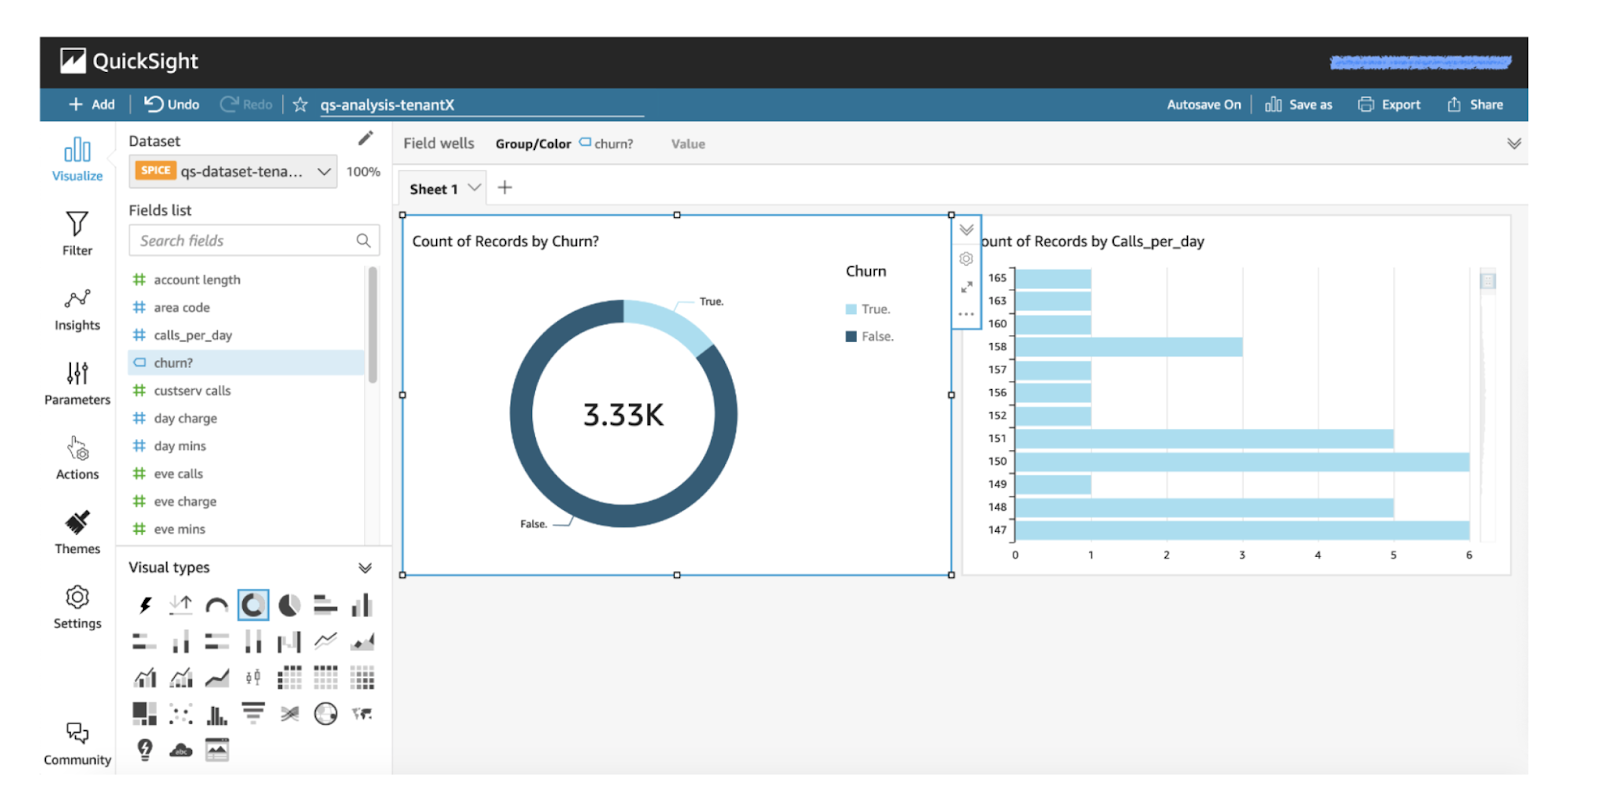
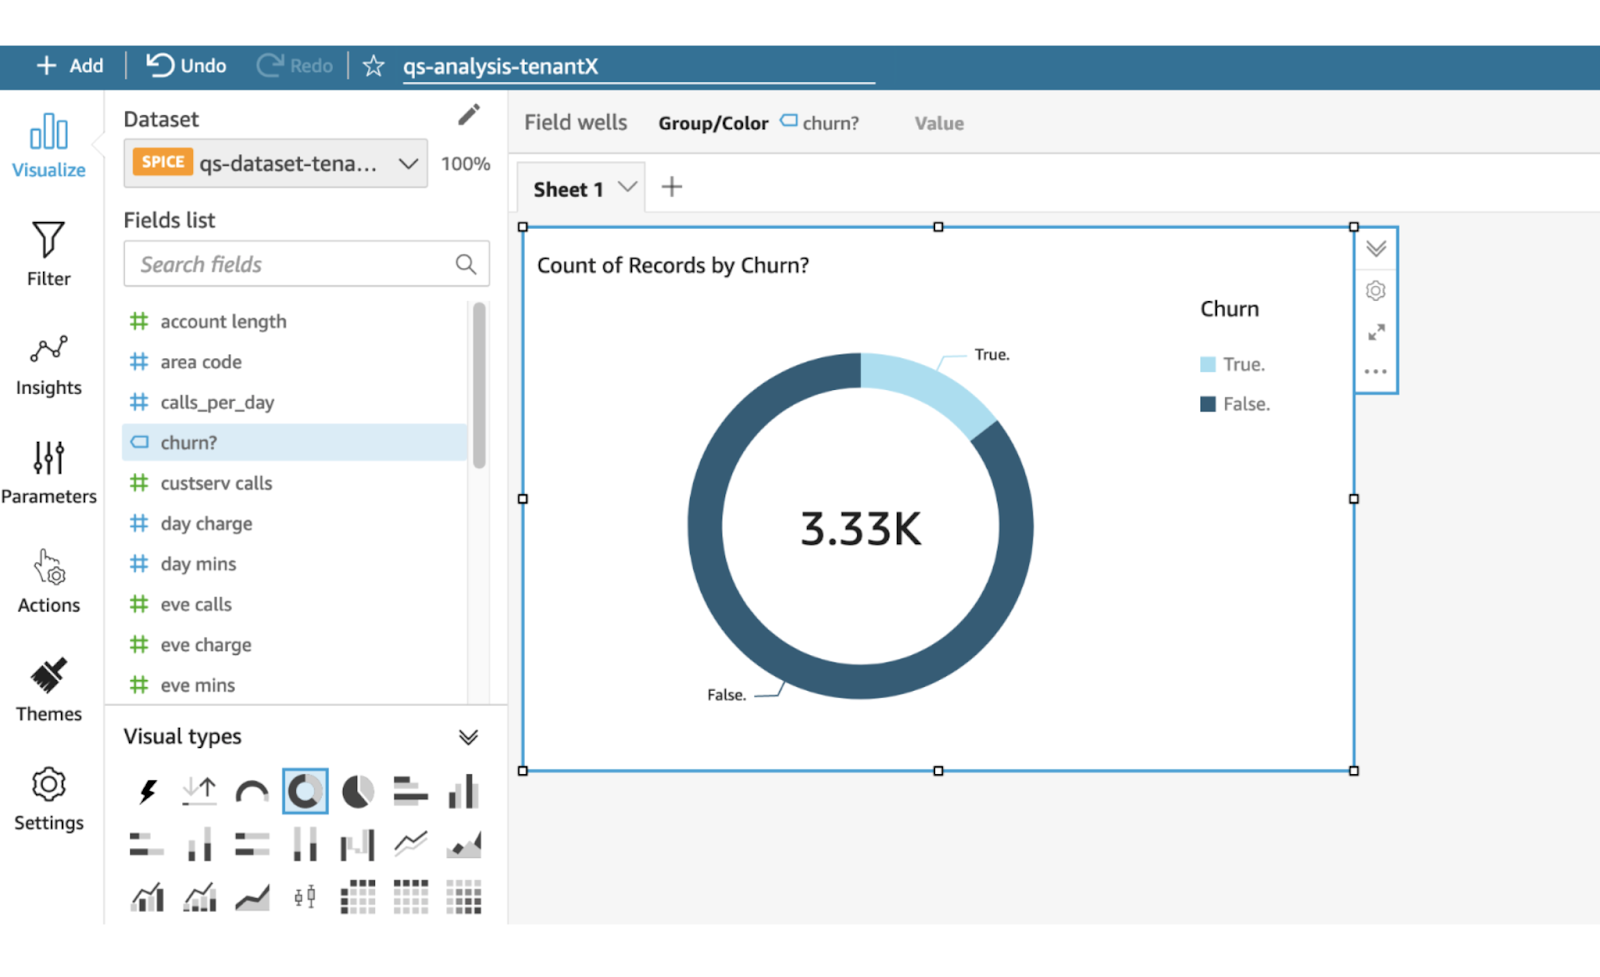
Choose a dataset from that list (which one exactly is irrelevant) and click on Create Analysis. Then, build an example dashboard by choosing a field in your dataset in the Fields list and then combining that with the Visual types below.
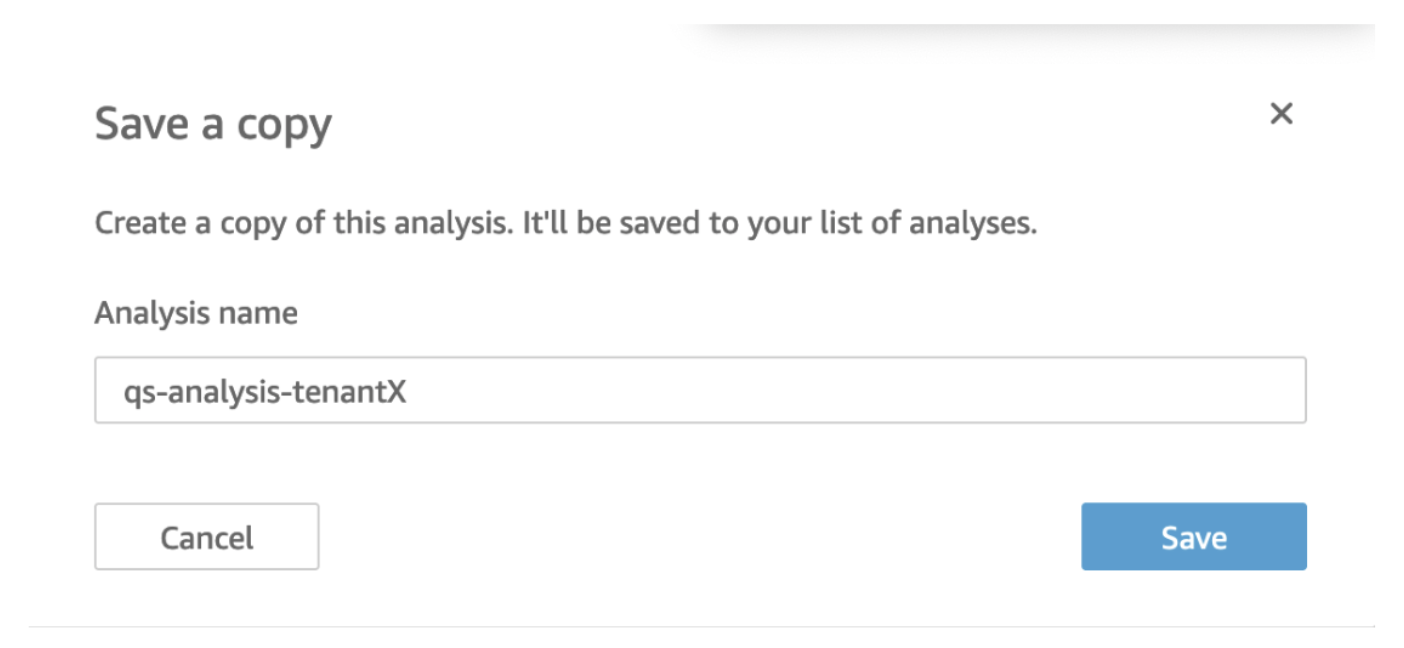
Save your analysis using the Save as button.
This Analysis will serve as our generic, abstract dashboard for all tenants. Even though we have chosen a specific dataset as its source, since all tenants have the same schema, we will be able to swap the source for a different tenant.
Step 3 - Create a Template
Our generic Analysis has to be then transformed into a Template. Then, we will instantiate a Dashboard from the Template for each tenant separately.
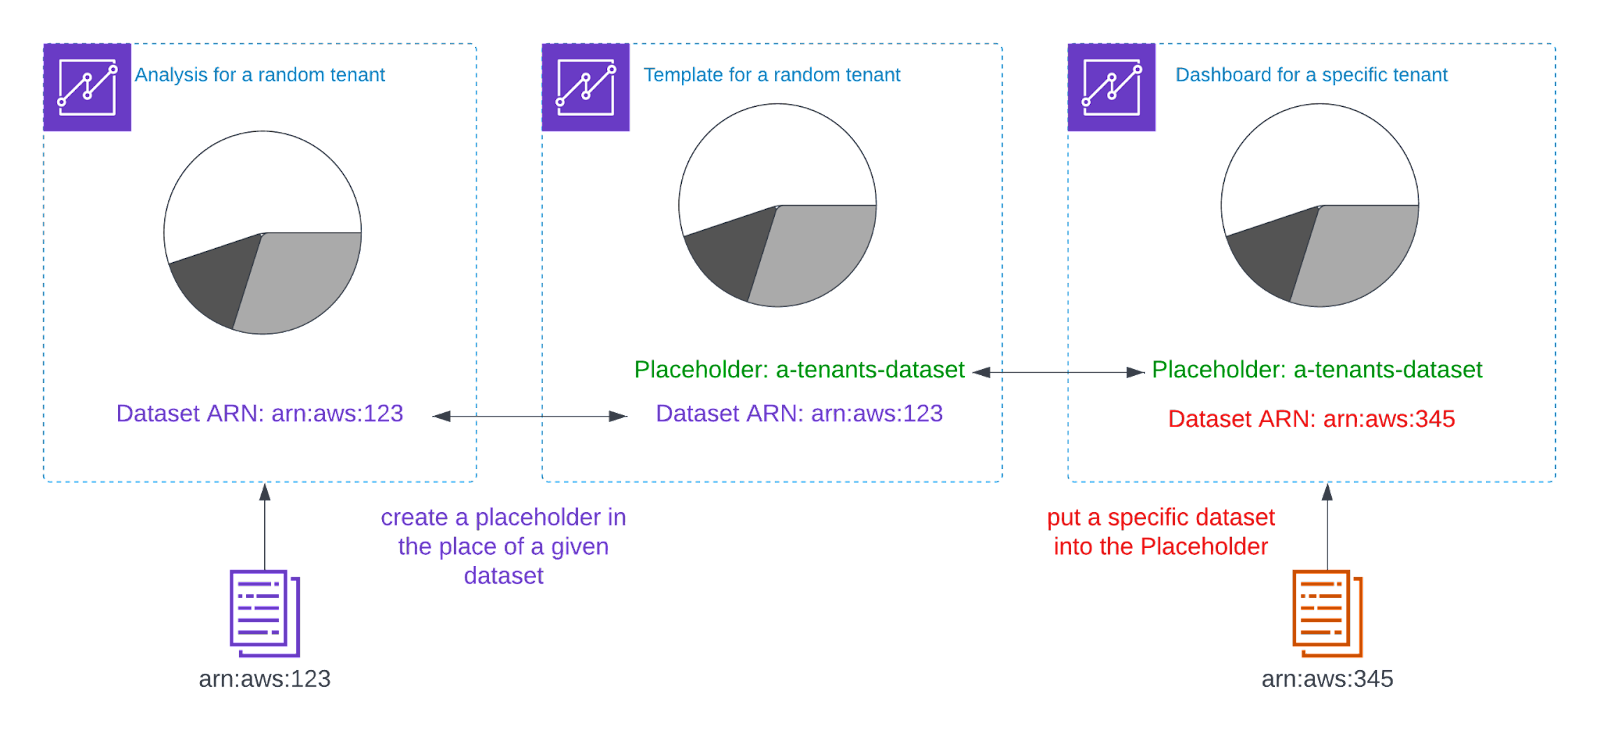
The relationship between Analysis, Templates, Dashboards and Datasets is shown below:
Unfortunately, Templates are nowhere to be found in QuickSight’s UI. You need to call aws-cli or use AWS SDK. We will show both options here, but they are interchangeable. You can do everything using AWS SDK and aws-cli.
First, we need to find the ARNs of the Analysis, the Dataset and your User. Run the following commands in the CLI:
aws quicksight list-analyses --aws-account-id <YOUR ACCOUNT ID>aws quicksight list-users --aws-account-id <YOUR ACCOUNT ID> --namespace defaultaws quicksight list-data-sets --aws-account-id <YOUR ACCOUNT ID>
And save all ARNs of the corresponding resources.
Then, using AWS SDK run the following code snippet. Make sure to replace the various <PLACEHOLDERS> with your data:
import boto3qs_client = boto3.client("quicksight")qs_client.create_template(AwsAccountId="<YOUR AWS ACCOUNT ID>",TemplateId="test-template-id",Name="test-template",Permissions=[{"Principal": "<ARN OF YOUR USER>","Actions": ["quicksight:UpdateTemplatePermissions","quicksight:DescribeTemplatePermissions","quicksight:UpdateTemplateAlias","quicksight:DeleteTemplateAlias","quicksight:DescribeTemplateAlias","quicksight:ListTemplateAliases","quicksight:ListTemplates","quicksight:CreateTemplateAlias","quicksight:DeleteTemplate","quicksight:UpdateTemplate","quicksight:ListTemplateVersions","quicksight:DescribeTemplate","quicksight:CreateTemplate",],}],SourceEntity={"SourceAnalysis": {"Arn": "<ARN OF THE ANALYSIS>","DataSetReferences": [{"DataSetPlaceholder": "a-tenants-dataset","DataSetArn": "<ARN OF THE DATASET>",},],}},)
This will create your Template that can be reused between tenants. Use list-templates to find its ARN required in the next step.
Step 4 - Instantiate a Dashboard
Now, this template can be used to rapidly create dashboards for a given tenant. Starting with tenant X, to create an accessible dashboard, all you have to do is call the following API:
import boto3qs_client = boto3.client("quicksight")qs_client.create_dashboard(AwsAccountId="<YOUR ACCOUNT ID>",DashboardId="dashboard-tenantX",Name="dashboard-tenantX",Permissions=[{"Principal": "<ARN OF YOUR USER>","Actions": ["quicksight:DescribeDashboard","quicksight:QueryDashboard","quicksight:ListDashboardVersions",],}],SourceEntity={"SourceTemplate": {"Arn": "arn:aws:quicksight:eu-west-1:<YOUR ACCOUNT ID>:template/test-template-id","DataSetReferences": [{"DataSetPlaceholder": "a-tenants-dataset","DataSetArn": "<TENANT X DATASET ARN>",},],}},)
Repeat this step, replacing tenant X with other two tenants (and make sure you also swap the corresponding dataset ARN each time).
This will result in three dashboards:
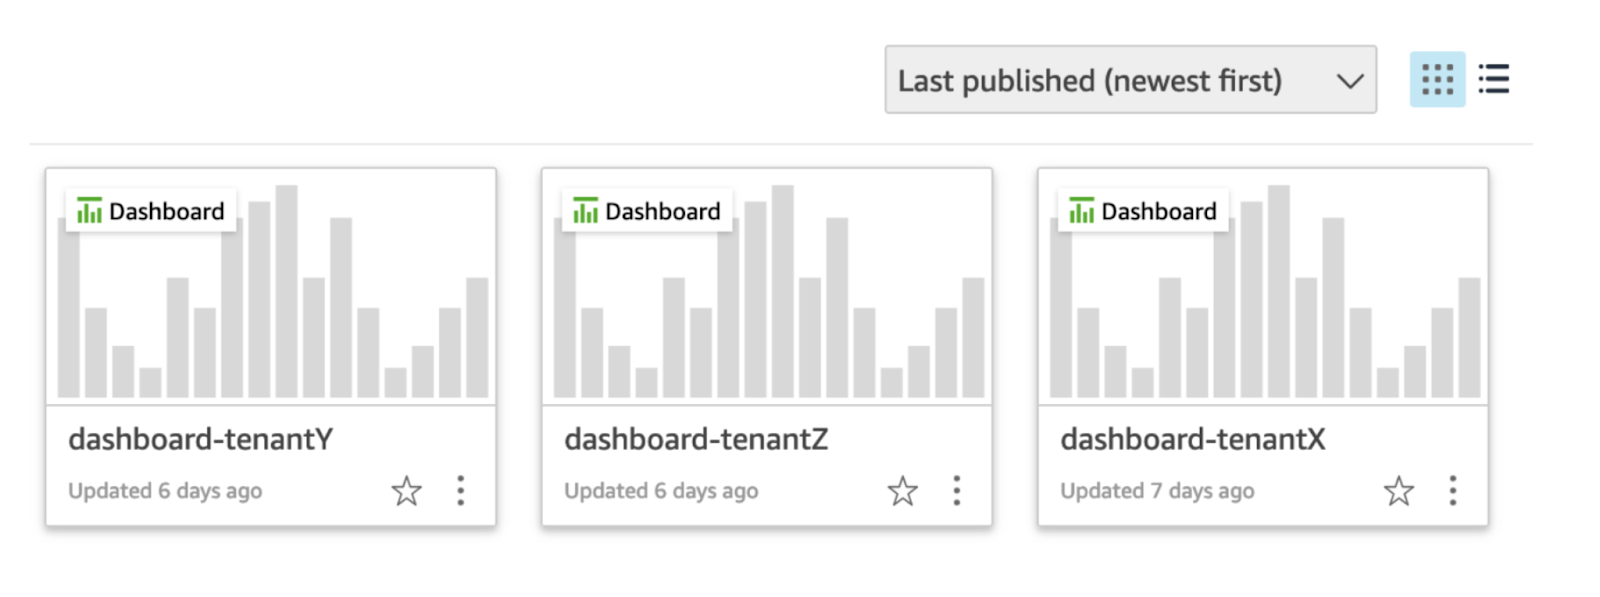
Each dashboard has the same widgets but a different underlying dataset. You can click on it to browse your insights for a given tenant.
Step 5 - deploy and propagate a new version
Lastly, let’s see how a new version of our generic dashboard can be quickly propagated to all tenants with little manual work.
Open your analysis and change it however you wish. We just removed one widget:
Save your analysis and proceed to apply it to your tenants. You need to call update_template first, and then do update_dashboard and update_dashboard_published_version for each tenant:
import boto3qs_client = boto3.client("quicksight")qs_client.update_template(AwsAccountId="<YOUR AWS ACCOUNT ID>",TemplateId="test-template-id",SourceEntity={"SourceAnalysis": {"Arn": "<ANALYSIS ARN>","DataSetReferences": [{"DataSetPlaceholder": "a-tenants-dataset","DataSetArn": "<ARN OF THE DATASET>",},],}},)qs_client.update_dashboard(AwsAccountId="<YOUR AWS ACCOUNT ID>",DashboardId="dashboard-tenantX",Name="dashboard-tenantX",SourceEntity={"SourceTemplate": {"Arn": "arn:aws:quicksight:eu-west-1:<YOUR AWS ACCOUNT ID>:template/test-template-id","DataSetReferences": [{"DataSetPlaceholder": "a-tenants-dataset","DataSetArn": "<ARN OF THE TENANT X DATASET>",},],}},)qs_client.update_dashboard_published_version(AwsAccountId="<YOUR AWS ACCOUNT ID>",DashboardId="dashboard-tenantX",VersionNumber=2,)
After running the code, you can browse the updated version:
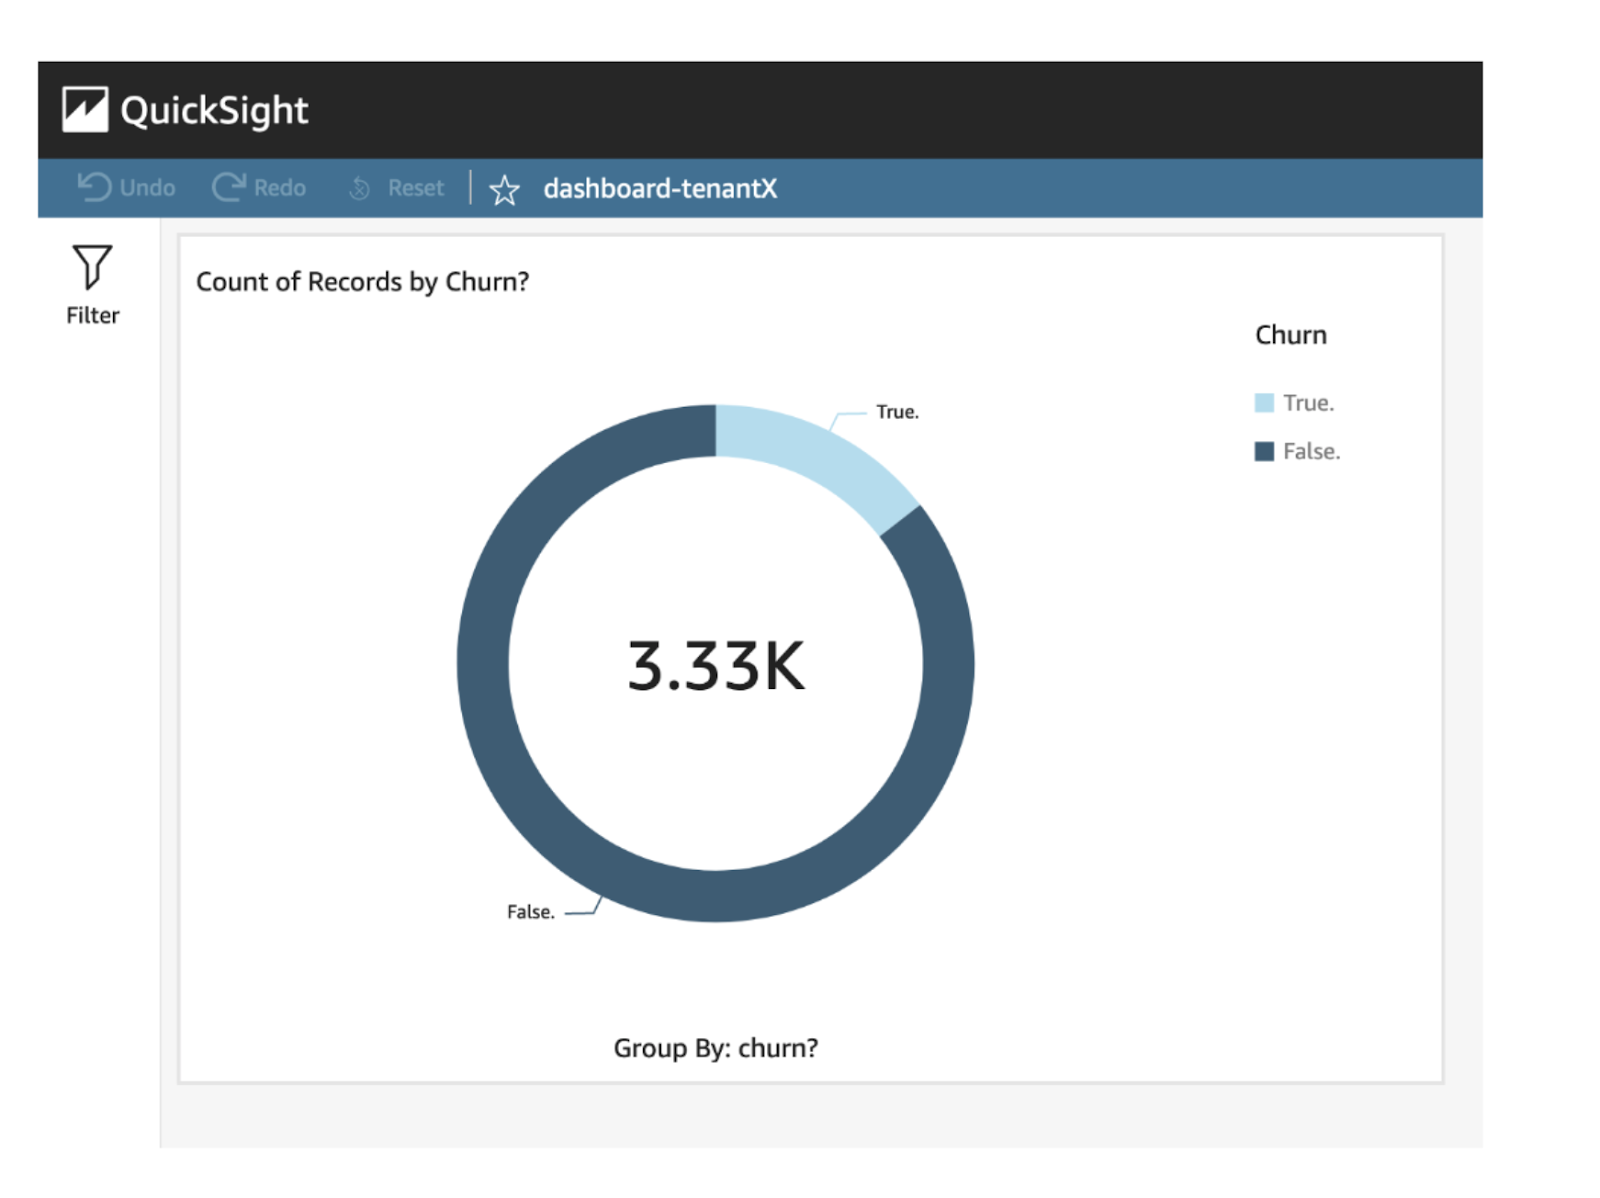
Few more API calls and the new version can be applied to other tenants.
Summary
This example shows how using the QuickSight Templates mechanism enables you to reuse your dashboards between customers of your SaaS Business Intelligence application.
Of course, we have only scratched the surface. As you can see, there’s still a lot of juggling between various API calls. You also need to store all the ARNs, automate your processes, design your access and identity management and build an application on top of your dashboards.
But the Templates mechanism ensures that the foundation of your BI application is properly designed and ready to scale for hundreds of tenants. All new changes and new versions of your dashboards can be easily propagated across any number of customers. Orchestration of that is the easy part and can be done with AWS Step Functions, AWS Lambda and Amazon EventBridge.
